
Exhaust gasses (off-gasses) are the waste substances of combustion inside the engine. They are products of oxidation and incomplete combustion of hydrocarbon fuel. Emissions of exhaust gasses are the main reason for excess of admissible concentration of toxic substances and carcinogens in the atmosphere of the large cities, formations of the smog’s which are the frequent reason of poisoning in self contained spaces. Chemical components contained in the exhaust gasses have a harmful effect on various human organs. Pollution of the atmosphere leads to a decrease in oxygen and an increase in carbon dioxide, which entails a number of stable weather changes. Researches of scientists show that from year to year the maintenance of carbonic gas in the atmosphere increases. This leads to the so-called “greenhouse effect”, i.e. an increase in the average annual temperature on the planet by an average of 0.8-3%, which, in turn, will lead to significant climate changes.
Automotive manufacturers continuously improve engine systems to reduce harmful contents in exhaust gasses and scientists continuously recharge & invent new technologies to reduce exhaust gas components entering into the atmosphere. Presently the most common & effective way to minimize pollutants are exhaust gas passing through catalytic converter & particulate matter where they react with noble catalysts and neutralize before entering into air. The five gasses measured (for petrol emissions) by the latest technology exhaust analyzers are: HC, CO, CO2, O2 and NOx. All five of these gasses, especially O2 and CO2, are excellent troubleshooting tools. Use of an exhaust gas analyzer will narrow down the potential cause of drivability and emissions concerns. A four or five Gas Exhaust Analyzer can be helpful in troubleshooting both emissions and drivability concerns. In troubleshooting, always remember the combustion chemistry equation: Fuel (hydrogen, carbon, Sulphur) + Air (nitrogen, oxygen) = Carbon dioxide (CO2 ) + water vapor (H2O) + oxygen (O2) + carbon monoxide (CO) + hydrocarbon (HC) + oxides of nitrogen (NOX) + Sulphur oxides (SOX).
Carbon dioxide (CO2 ): CO2 reading is the indication of stoichiometric combustion efficiency in the cylinder. High reading indicates high efficiency. With lambda value 1 the CO2 reading will vary 14.5-16%. If one cylinder in a 4 cylinder engine misfires then the CO2 reading will be approx. 25% lower. But tail pipe reading depends on catalytic converter efficiency.
Carbon monoxide (CO): CO is the byproduct of incomplete combustion and high reading indicates a rich air fuel ratio. Ideal CO reading should be close to or slightly higher than O2 reading but not zero. For modern engines with good combustion CO reading should be 0.1-0.45%. Generally CO reading is close to or slightly higher than O2 reading and within 0.1% higher of O2 is standard.
Oxygen O2: O2 reading is the indication of lean or rich mixture. The lower the O2 the richer the mixture and vice versa. For ideal conditions O2 reading should be close to or slightly lower than CO reading and within 0.1% lower of CO is standard. Ideal O2 reading varies from 0.0-0.35%.
Hydrocarbon (HC): High HC reading can result from rich mixture, misfire, Air intake sensor malfunction or mechanical defects of engine. For ideal combustion HC reading lies between 0-35 ppm. High HC with high O2 reading indicates misfire or cylinder imbalance and may cause converters to overheat, melt substrates or block. An approximate relationship between the percentage of wasted fuel through incomplete combustion and the ppm of HC is about 1/200 ( 1.0% partially burned fuel produces 200 ppm HC, 10%=2000 ppm HC, 0.1%=20 ppm HC )
Oxides of nitrogen (NOX): NOX is normally measured in a Dynamometer with engine partial load. The NOX reading is as low as possible as well.
|
Typical gas analyzer reading with good engine & perfectly working catalytic converter. |
||||
|
CO2 |
CO |
HC |
O2 |
Lambda (λ) |
|
14.5-16% |
0.1-0.45% |
0-35 ppm |
0-.35% |
.995-1.005 |
|
Typical gas analyzer reading with good engine but a converter with bad O2 heater . |
||||
|
CO2 |
CO |
HC |
O2 |
Lambda |
|
13.5-14.5 |
0.5-0.9% |
75-125 ppm |
0.3-0.7% |
0.995-1.005 |
General Rules of Emission Analysis:
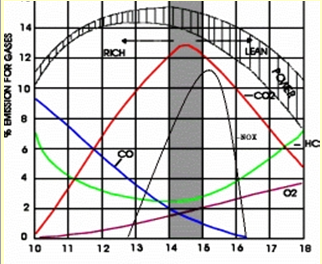
Figure. Typical Air fuel ratio relationship diagram
- If CO goes up, O2 goes down, and conversely if O2 goes up, CO goes down. Remember, CO readings are an indicator of a rich running engine and O2 readings are an indicator of a lean running engine.
- If HC increases as a result of a lean misfire, O2 will also increase
- CO2 will decrease in any of the above cases because of an air/fuel imbalance or misfire
- An increase in CO does not necessarily mean there will be an increase in HC. Additional HC will only be created at the point where rich misfire begins (3% to 4% CO)
- High HC, low CO, and high O2 at same time indicates a misfire due to lean or EGR diluted mixture
- High HC, high CO, and high O2 at same time indicates a misfire due to excessively rich mixture.
- High HC, Normal to marginally low CO, high O2, indicates a misfire due to a mechanical engine problem or ignition misfire
- Normal to marginally high HC, Normal to marginally low CO, and high O2 indicates a misfire due to false air or marginally lean mixture.
Here is some quick reference chart to show the correlation of exhaust gasses with engine electronic or mechanical troubles.
|
Symptoms & causes of exhaust gas readings increase or decrease: |
|||||
|
Symptom |
HC |
CO |
CO2 |
O2 |
NOX |
|
Ignition misfire |
Large increase |
Some decrease |
Some Decrease |
Some to large increase |
Some to large decrease |
|
Compression loss |
Some to large Increase |
Some decrease |
Some decrease |
Some Increase |
Some to large decrease |
|
Rich mixture |
Some to large Increase |
Large increase |
Some decrease |
Some Decrease |
Some to large decrease |
|
Lean mixture |
Some Increase |
Large Decrease |
Some Decrease |
Some Increase |
Some to large increase |
|
Very lean mixture |
Large Increase |
Large Decrease |
Some Decrease |
Large Increase |
Some to large decrease |
|
Slightly retired timing |
Some decrease |
No change or Some increase |
No change |
No change |
Large Decrease |
|
Very retired timing |
Some Increase |
No Change |
Some to large Decrease |
No Change |
Large Decrease |
|
Advance timing |
Some Increase |
No change or Some decrease |
No change |
No Change |
Large Increase |
|
EGR operating |
No Change |
No Change |
Some Decrease |
No Change |
Large Decrease |
|
EGR Leaking |
Some Increase |
No Change |
No change or Some decrease |
No Change |
Some decrease or No change |
|
Air injection operation |
Large Decrease |
Large Decrease |
Some to large Decrease |
Large Increase |
No Change |
|
Catalytic converter working |
Some Decrease |
Some Decrease |
Some Increase |
Some Decrease |
Some Decrease W/3-w cat |
|
Catalytic converter in-operative |
Some to large Increase |
Some to large increase |
Some Decrease |
Some Increase |
Some Increased W/3-w cat |
|
Exhaust leak |
Some Decrease |
Some Decrease |
Some Decrease |
Some Increase |
No change |
|
Worn engine |
Some Increase |
Some Increase |
Some Decrease |
Some Decrease |
No change or Slight decrease |
|
O2 sensor biased low |
Some Increase |
Some to large Increase |
Some Decrease |
Some Decrease |
Some Decrease |
|
O2 sensor biased high |
Some Increase |
Some decrease |
Some Decrease |
Some increase |
Some increase |
|
Camshaft worn |
No change or Some decrease |
Some Decrease |
Some Decrease |
No change or Some decrease |
No change or Some decrease |
We’ve only discussed the creation and causes of tailpipe or exhaust emission output. However, it should be noted that hydrocarbon (HC) emissions come from the tailpipe, as well as other evaporative sources, like the crankcase, fuel tank and evaporative emissions recovery system. In fact, studies indicate that as much as 20% of all HC emissions from automobiles comes from the fuel tank and carburetor.
Thanks everyone for reading.


53SIlXYLEnc